Dover Building Coastal Resilience by Building Equity
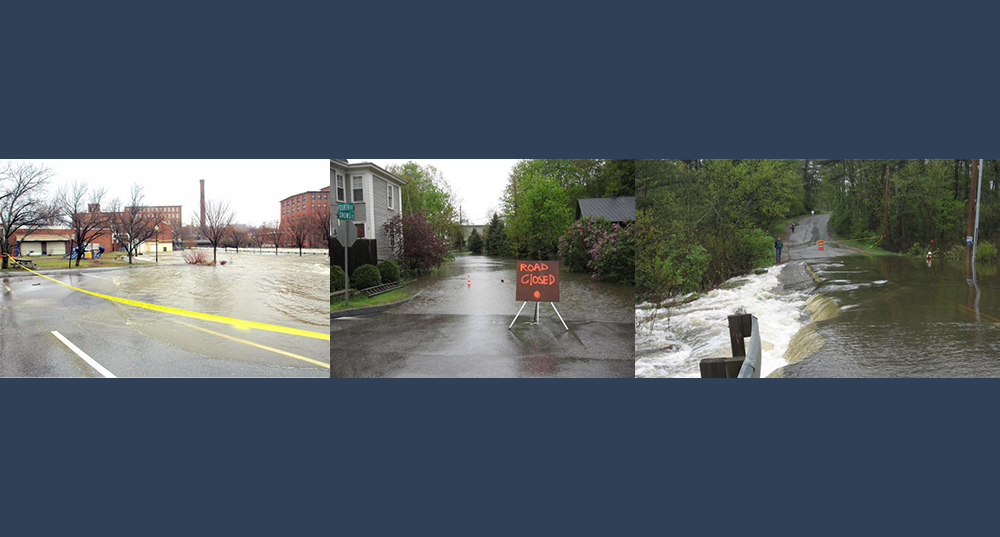
The goal of the Dover Building Coastal Resilience by Building Equity project was to engage Dover’s historically underserved communities (HUCs) in climate change conversations. HUCs are often disproportionately vulnerable to climate change impacts such as sea level rise, coastal flooding, freshwater availability, and urban heat island effects. The project, funded through a Resilience Municipal Planning Grant, aimed to identify these vulnerable members of the community in order to include their history, perspectives, and voices, as well as to diversify input the City currently receives related to climate adaptation planning. The project team interviewed service providers to learn more about their clientele to more effectively approach direct engagement with their target population and build a foundation of trust. The team held workshops with residents at two Dover Housing Authority locations and students in the Dover Adult Learning Center’s Civics class to integrate their experiences into recommendations to the City.
Recommendations were supplemented and contextualized by additional data visualizations including a 23-part map set and evaluation of the City’s core planning documents. The team held a wrap-up meeting and invited everyone from the outreach network they developed to comment on and prioritize the list of recommendations and related actions. A survey was sent out for those who couldn’t attend the meeting; feedback from these activities were incorporated into recommendations to the city to ensure everyone’s voices were accurately represented. The final map set can be viewed on this page.
Figure 1 – Sensitive Populations
Figure 4 – Transit Access for Low Income Populations
Figure 5 – Existing Tract Vulnerability
Figure 6 – Households Below Federal Poverty Threshold
Figure 7 – Bus Access and Minority Populations
Figure 8 – Pedestrian Infrastructure and Minority Populations
Figure 9 – Drinking Water Resources
Figure 10 – Transportation Infrastructure
Figure 11 – Water Infrastructure
Figure 12 – Emergency/Non-Emergency Response Facilities
Figure 14 – Cultural Resources
Figure 16 – Contamination Sites
Figure 17 – Sea Level Rise & Storm Surge
Figure 18 – Urban Heat Island Effect
Figure 19 – Pedestrian Infrastructure in the Floodplain
Figure 20 – Public Transportation in Urban Heat Islands
Figure 21 – Sensitive Populations in Urban Heat Islands


